
Research of Statistical Recurrences of Candle Directions
Introduction
Hello,
I would like to draw your attention to the following thought. Is it possible to predict the behavior of the market for a short upcoming period of time, based on the recurring tendencies of candle directions at specific times throughout the day? That is, If such an occurrence is found in the first place.
Basically, if we would find that over the past few days, at a specific time, the candles always had the same direction, then this in itself would be interesting. After all, any technical analysis is essentially reduced to finding statistically significant relationships.
A repetitive change in direction of candles indicates a change in the trend
Let's first agree on some terms. Although these terms are commonly used, let us go through them one more time to avoid misunderstandings. If the opening price of the candle is less than the closing price - then it is called a bullish candle (on the proposed figures they are painted in white), if on the contrary, the price is a bear price, then they are (painted in black). If the opening price is equal to the closing price, these candles will be called equal (my own term). If the quote price declined over a period of time, then we have a bearish trend for this period, and if on the contrary, then we have a bullish trend.
Let's look at the graph:
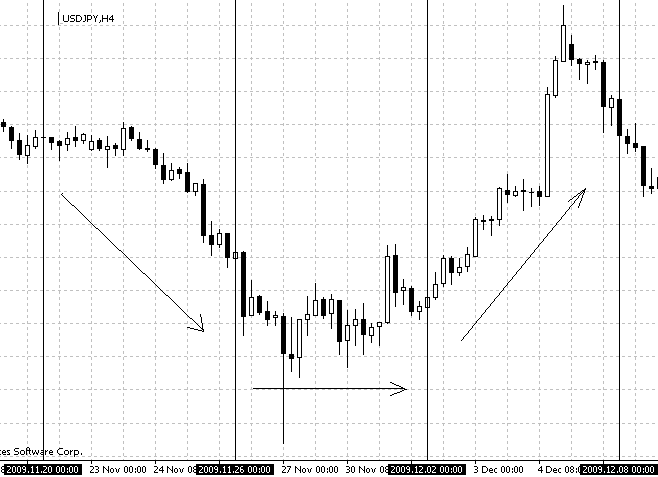
Figure 1. Candlestick chart for 4-hour timeframes USDJPY, with 20.11.2009 on 08.12.2008
As seen in Figure 1, if the trend is bearish, then the candles which make up this trend are mostly bearish, and if it's bullish, then the candles are also bullish. If its' lateral, then the candles also constantly change their direction.
Actually, our problem - is to determine whether there is any recurrences in the candles, and how it changes in respect to the changes in the trend .
Of course, all this can be done manually, for example, we can take an hourly graph or any other type of graph, write out the candle directions on a piece of paper, and compare them with each other for some time. This is a lot of work, but is can be done. But we have the wonderful tool of the MQL4 programming language, with which we can easily create an Expert Advisor, which will calculate everything itself and tell us all about the results of the calculations.
So what do we need:
- First, we must be able to specify a time period that interests us. It is unlikely that there are 15-minute candles, which, with a probability of 100% were bearish at 7:15 every day, for the past couple of years. Although we must have the ability to test this, at least for the period of the past six months, since there is still a slight chance of this.
- Secondly, it would be nice to know how many candles, during the period under review, were bullish and how many were bearish. You must agree that if during the last 10 days, the hourly candles which open at 18:00 - were bullish 6 times and bearish 4 times, then it is unlikely that this information will present us with something significant. Now, if they were bearish 9 times out of 10, then this information should be taken into account, for example, in order to decide in which direction to open towards today at 18:00.
- Thirdly, it would be also nice to know the average distance between the opening and closing prices of candles, as well as their average height over the given period.
- Fourth of all, we should be able to carry out our calculations on different timeframes.
All this can be defined in the external variables of the proposed script - script_Statistics_candles .
Let's look at the following picture.

Figure 2. Input parameters of the script
Figure 2 shows the input parameters that can be changed in the script.
Open_session - Starting time of the study session
Close_session - Ending time of the study session
Period_time - Timeframe on which the script considers the probability of candle recurrence. Can take one of the following values - 5, 15, 30, 60, 240. Please remember that these, and no other, are the permissible values. Accordingly, these values correspond to periods of graphs - 5, 15, 30 minutes, 1 hour and 4 hours.
Below is the code of the script. I add a maximum amount of comment to the code, because I myself am in the process of studying a textbook on MQL4, and repeatedly turn to Expert Advisors, laid out on this site and most frequently to those with detailed comments. It is no secret that any article, laid out on this site, has, aside from other things, a teaching value, for those who are taking their first steps in using MQL4.
//+------------------------------------------------------------------+
//|                                 script_Statistics_candles_V2.mq4 |
//|                              Copyright © 2009, Igor Aleksandrov  |
//|                                                sydiya@rambler.ru |
//+------------------------------------------------------------------+
#property copyright "Copyright © 2009, Igor Aleksandrov"
#property link      "sydiya@rambler.ru"
#property show_inputs
//---- Input parameters

extern string  Open_session ="2009.11.20";   //Date of the opening of the studied session
extern string  Close_session = "2009.11.26"; //Date of the closing of the studied session
extern int     Period_time = 60;             //Period of the graph on which the Expert Advisor will be working,
                                             //can take the value of 5;15;30;60;240
//-----------------------------------------------------------------
int
    Day_bars_i;                      //Number for i bar in session
double
    Mas_vira_maina[24,60]={0,0 0,0}, //Declare an array for bars with an equal opening-closing price
    Mas_vira[24,60]={0,0 0,0},       //Declare an array for calculating bullish bars
    Mas_maina[24,60]={0,0 0,0},      //Declare an array for calculating bearish bars
    Mas_kol_vo[24,60]={0,0 0,0},     //Declare an array for calculating the number of the counted bars
    Mas_profit[24,60]={0,0 0.0},     //Declare an array of the calculation of profit by open-close
    Mas_H_L[24,60]={0,0 0.0};        //Declare an array of calculating the profit by high-low

string Symb;                         //Name of the financial. instrument on which the script is executed
bool New_day = false;                //Flag of the new day
//--------------------------------------------------------------------

//----------------------------Starting--------------------------------

int start()
  {                                  //-general opening bracket

  Print("----------------------------------------------------------------------");
  Print("  Results of the script's work- Statistics_candles- ",TimeToStr(TimeCurrent()) );
  Print("  Calculations completed from ",Open_session," to ",Close_session);

//------------------------Declare the variables ----------------------
  int
       Hour_open_bars,                  //Number of the hour of opening the i bar in session
       Minute_open_bars,                //Number of the minute of opening  i bar in session
       Shift_open,                      //Number of bar with opening time Open_session
       Shift_close,                     //Number of bar with opening time Close_session
       Shift_open_close,                //Number of bars in session
       Total_day=0;                     //Counter of counted days

  double Open_bars_price,               //Price of opening i bar of the session
         Close_bars_price,              //Price of closing the i bar of the session
         Low_bars_price,                //Minimum price of the i bar of the session
         High_bars_price,               //Maximum price of the i bar of the session
         Total_bars=0;                  //Number of studied bars at the start of the script

  datetime Time_open_session,           //Opening time of the first bar of the studied session
                                        //in datatime format
           Time_close_session,          //Opening time of the last bar of the studying
                                        //session in datatime format
           Time_open_bars;              //Opening time of bars in datatime format

  bool  Session_vira=false,             //Flag of the bullish session
        Session_maina=false;            //Flag of the bearish session
//-----------------------End of the variables declaration ------------------

  Symb=Symbol();                        //Name of the financial instrument

  //Request the starting time of the studied session in datatime format
  Time_open_session= StrToTime(Open_session);

  //Request the closing time of the studied session in datatime format
  Time_close_session= StrToTime(Close_session);

  //Request the number of the bar, opening the session
  Shift_open=iBarShift( Symb,Period_time, Time_open_session,false);

  //Request the number of the bar, which closes the session
  Shift_close=iBarShift( Symb,Period_time, Time_close_session,false);

//---------------------------------------------------------------------
for(int i = Shift_open; i>=Shift_close; i --)        //Cycle of bar searching in the session
{ //Opening bracket of the search cycle of bars
    Total_bars++;                                    //Counter of the number of studied bars
    static int New_day_shift=0;                      //Number of the day of starting the Expert Advisor

    //Request the opening of the i bar in session
    Time_open_bars=iTime( Symb,Period_time,Shift_open-Total_bars);

    //Request the opening hour of the i bar in session
    Hour_open_bars=TimeHour(Time_open_bars);

    //Request the opening minute of the i bar in session
    Minute_open_bars=TimeMinute(Time_open_bars);

    //Request the day number for the i bar in session
    Day_bars_i=TimeDayOfYear( Time_open_bars);

    //If the number for the first bar in session is not equal to the i-th bar of the day,then
    if(New_day_shift!=Day_bars_i)
      {
         New_day = true;               //flag for the new day is true
         New_day_shift=Day_bars_i;     //and assign the number for the number of the i bar
         Total_day++;                  //Increase the day counter by one
      }
      else                             //otherwise,
      {
      New_day = false;                 //Flag for the new day is false
      }
       //Request the opening price of the i-th bar
       Open_bars_price= iOpen( Symb, Period_time,i);

       //Request the closing price of the i-th bar
       Close_bars_price=iClose( Symb, Period_time,i);

       //Request the minimum price of the i-th bar
       Low_bars_price=iLow( Symb, Period_time,i);

       //Request the maximum price of the i-th bar
       High_bars_price=iHigh( Symb, Period_time,i);

       //If the opening price of the bar is lower than the closing price, then the session is bullish
       if(Open_bars_price<Close_bars_price)
          {
          //Increase by one the values of the corrsponding element
          Mas_vira[Hour_open_bars,Minute_open_bars]=Mas_vira[Hour_open_bars,Minute_open_bars]+1;

          //Increase by one the values of the corrsponding element
          Mas_kol_vo[Hour_open_bars,Minute_open_bars]=Mas_kol_vo[Hour_open_bars,Minute_open_bars]+1;

          //Save the difference between the opening and closing price in points
          Mas_profit[Hour_open_bars,Minute_open_bars]=
          Mas_profit[Hour_open_bars,Minute_open_bars]+(Close_bars_price-Open_bars_price)/Point;

          //Save the difference between the maximum and minimum price in points
          Mas_H_L[Hour_open_bars,Minute_open_bars]=
          Mas_H_L[Hour_open_bars,Minute_open_bars]+(High_bars_price-Low_bars_price)/Point;
          }

       //If the opening price of the bar is higher than the closing price, then the session is bearish
       if(Open_bars_price>Close_bars_price)
          {
           //Increase by one the values of the corrsponding element
           Mas_maina[Hour_open_bars,Minute_open_bars]=Mas_maina[Hour_open_bars,Minute_open_bars]+1;

           //Increase by one the values of the corrsponding element
           Mas_kol_vo[Hour_open_bars,Minute_open_bars]=Mas_kol_vo[Hour_open_bars,Minute_open_bars]+1;

          //Save the difference between the opening and closing price in points
           Mas_profit[Hour_open_bars,Minute_open_bars]=
           Mas_profit[Hour_open_bars,Minute_open_bars]+(Open_bars_price-Close_bars_price)/Point;

          //Save the difference between the maximum and minimum price in points
           Mas_H_L[Hour_open_bars,Minute_open_bars]=
           Mas_H_L[Hour_open_bars,Minute_open_bars]+(High_bars_price-Low_bars_price)/Point;
          }

        //If the opening price is equal to the closing price, then session is undefined
        if(Open_bars_price==Close_bars_price)
          {
           ///Increase by one the corresponding array elements
           Mas_vira_maina[Hour_open_bars,Minute_open_bars]=Mas_vira_maina[Hour_open_bars,Minute_open_bars]+1;

           //Increase by one the corresponding array elements
           Mas_kol_vo[Hour_open_bars,Minute_open_bars]=Mas_kol_vo[Hour_open_bars,Minute_open_bars]+1;

           //Leave the value of the array as is
           Mas_profit[Hour_open_bars,Minute_open_bars]=
           Mas_profit[Hour_open_bars,Minute_open_bars]+0;

           //Save the difference between maximum and minimum bar prices in points
           Mas_H_L[Hour_open_bars,Minute_open_bars]=
           Mas_H_L[Hour_open_bars,Minute_open_bars]+(High_bars_price-Low_bars_price)/Point;
          }

} //Closing bracket of the bar search cycle
//--------------------------Print the information to the Expert Advisor Journal-------------------

Print("Processed - ",Total_day," days; ",Total_bars," bars, period ",Period_time," minutes");

for (int h=0; h<=23; h++) //Hours cycle
{
  for (int m=0; m<=60; m++) //Minutes cycle
   {
    if (Mas_kol_vo[h,m]!=0) //If the value of array is not equal to zero, then we continue counting
    {
  Print("For the period there are ",Mas_kol_vo[h,m],
       " bars with the time of the opening ",h,":",m,
       " .Bullish- ",Mas_vira[h,m],
       ".Bearish- ",Mas_maina[h,m],
       ".Equal - ",Mas_vira_maina[h,m]);
  Print("For the bars with the opening time ",h,":",m,
       " ,average distance between the Open-Close prices - ",Mas_profit[h,m]/Mas_kol_vo[h,m],
       " points. Between the High-Low prices - ",Mas_H_L[h,m]/Mas_kol_vo[h,m]," points.");
     }
           Mas_vira_maina[h,m]=0;  //set to zero
           Mas_vira[h,m]=0;        //set to zero
           Mas_maina[h,m]=0;       //set to zero
           Mas_kol_vo[h,m]=0;      //set to zero
           Mas_profit[h,m]=0;      //set to zero
           Mas_H_L[h,m]=0;         //set to zero
   } //End of the minute cycle
} //End of the hour cycle

Print("-------------- Script completed the work --------------------");

   return(0);
  }                                        //-general closing bracket
As you can see, I declare six arrays at the global level under calculation.
double
Mas_vira_maina[24,60]={0,0 0,0}, //Declare the bar array with an equal price of opening-closing
Mas_vira[24,60]={0,0 0,0},       //Declare the array for calculating the bullish bars
Mas_maina[24,60]={0,0 0,0},      //Declare the array for calculating the bearish bars
Mas_kol_vo[24,60]={0,0 0,0},     //Declare the array for calculating the number of counted bars
Mas_profit[24,60]={0,0 0.0},     //Declare the array for calculating the profit for open-close
Mas_H_L[24,60]={0,0 0.0};        //Declare the array for calculating the profit for high-low
Into the Mas_kol_vo buffer we will record the number of counted bars. Why this is necessary. It would seem, that the values of cell arrays for open-close and for high-low, could be divided by the number of counted days, especially since there is a counter in the code.- Total_day . But in the process of working on the script, I was faced with the lack of some bars in history, so the results were appearing to be quiet interesting. For example, the height obtained for some of the bars was completely unrealistic.
What the remaining arrays are needed for is clear from the comments.
And now actually, check the repeatability of bars with different directions of the trend. To do this let's take the hourly graph for the USDJPY, shown in Figure 1. As we can seen, from 20.11.2009 to 26.11.2009, the graph has a bearish direction, from 26.11.2009 to 02.12.2009 has a sideways trend, and from 2.12.2009 to 12.08.2009 has a bullish trend.
Let's check whether there are repetitive candles during this period, and if there are, then figure out the direction of their changes.
Set the script to the hourly graph. For those who do not know how this is done, I will provide a more detailed description. The script -script_Statistics_candles_V2.mq4, is downloaded into the folder \Program Files\TerminalName\expert\scripts. Copy. The script appears in the lower left corner of the "Navigator" window. It looks like this:

Figure 3. Navigator window
If you drag the script with the mouse from this window to the terminal window, you will see a properties window - Fig. 2. Specify the starting and ending date for the calculation.
In order to understand the logic of our actions, please consider the following. Imagine that the first thing you do in the morning, after rising from bed, is run this script. Next you input the results of its work into a table, an example of which is provided below under number 1. Your task is to attempt to understand, based on the results of the script, what will be happening in the market in the next day or two.
So let's say today is November 26th, 2009. You run the script, and you are interested in the statistics of the candles in say, the past 6 calendar day. You set the properties of the script to: Open_session - 2009.11.20 (six days ago) Close_session - 2009.11.26 (ie today), any timeframe can be used for calculation, I'll be at the hourly graph, ie Period_time = 60. We will perform this on a daily basis, increasing the start and end of the script each time by one day.
We're going to do this based on historical data.
Click the "OK" button in the properties, in the Expert Advisors folder, in the Log file, see the following entry:
15:33:53 script_Statistics_candles_V2 EURUSD,H1 inputs: Open_session="2009.11.20"; Close_session="2009.11.26"; Period_time=60;
15:33:53 script_Statistics_candles_V2 EURUSD,H1: ----------------------------------------------------------------------
15:33:53 script_Statistics_candles_V2 EURUSD,H1: Results of the script's work- Statistics_candles- 14:32
15:33:53 script_Statistics_candles_V2 EURUSD,H1: Calculations completed from 2009.11.20 to 2009.11.26
15:33:53 script_Statistics_candles_V2 EURUSD,H1: Processed - 5 days; 95 bars, period 60 minutes
15:33:53 script_Statistics_candles_V2 EURUSD,H1: For the period there are 3 bars with the time of the opening 0:0 .Bullish- 1.Bearish- 2.Equal - 0
15:33:53 script_Statistics_candles_V2 EURUSD,H1: For the bars with the opening time 0:0,average distance between the Open-Close prices - 5.6667 points. Between the High-Low prices - 12 points.
15:33:53 script_Statistics_candles_V2 EURUSD,H1: For the period there are 5 bars with the time of the opening 1:0 .Bullish- 2.Bearish- 2.Equal - 1
15:33:53 script_Statistics_candles_V2 EURUSD,H1: For the bars with the opening time 1:0,average distance between the Open-Close prices - 4.2 points. Between the High-Low prices - 11.8 points.
15:33:53 script_Statistics_candles_V2 EURUSD,H1: For the period there are 4 bars with the time of the opening 2:0 .Bullish- 2.Bearish- 2.Equal - 0
15:33:53 script_Statistics_candles_V2 EURUSD,H1: For the bars with the opening time 2:0,average distance between the Open-Close prices - 7 points. Between the High-Low prices - 16.25 points.
15:33:53 script_Statistics_candles_V2 EURUSD,H1: For the period there are 4 bars with the time of the opening 3:0 .Bullish- 2.Bearish- 2.Equal - 0
15:33:53 script_Statistics_candles_V2 EURUSD,H1: For the bars with the opening time 3:0,average distance between the Open-Close prices - 11.5 points. Between the High-Low prices - 25.25 points.
15:33:53 script_Statistics_candles_V2 EURUSD,H1: For the period there are 4 bars with the time of the opening 4:0 .Bullish- 2.Bearish- 2.Equal - 0
15:33:53 script_Statistics_candles_V2 EURUSD,H1: For the bars with the opening time 4:0,average distance between the Open-Close prices - 12.25 points. Between the High-Low prices - 21 points.
15:33:53 script_Statistics_candles_V2 EURUSD,H1: For the period there are 4 bars with the time of the opening 5:0 .Bullish- 3.Bearish- 1.Equal - 0
15:33:53 script_Statistics_candles_V2 EURUSD,H1: For the bars with the opening time 5:0,average distance between the Open-Close prices - 9.25 points. Between the High-Low prices - 17.75 points.
15:33:53 script_Statistics_candles_V2 EURUSD,H1: For the period there are 4 bars with the time of the opening 6:0 .Bullish- 3.Bearish- 1.Equal - 0
15:33:53 script_Statistics_candles_V2 EURUSD,H1: For the bars with the opening time 6:0,average distance between the Open-Close prices - 13.5 points. Between the High-Low prices - 22 points.
15:33:53 script_Statistics_candles_V2 EURUSD,H1: For the period there are 4 bars with the time of the opening 7:0 .Bullish- 4.Bearish- 0.Equal - 0
15:33:53 script_Statistics_candles_V2 EURUSD,H1: For the bars with the opening time 7:0,average distance between the Open-Close prices - 5.75 points. Between the High-Low prices - 15.25 points.
15:33:53 script_Statistics_candles_V2 EURUSD,H1: For the period there are 4 bars with the time of the opening 8:0 .Bullish- 1.Bearish- 3.Equal - 0
15:33:53 script_Statistics_candles_V2 EURUSD,H1: For the bars with the opening time 8:0,average distance between the Open-Close prices - 8.25 points. Between the High-Low prices - 22.75 points.
15:33:53 script_Statistics_candles_V2 EURUSD,H1: For the period there are 4 bars with the time of the opening 9:0 .Bullish- 1.Bearish- 3.Equal - 0
15:33:53 script_Statistics_candles_V2 EURUSD,H1: For the bars with the opening time 9:0,average distance between the Open-Close prices - 10.75 points. Between the High-Low prices - 22 points.
15:33:53 script_Statistics_candles_V2 EURUSD,H1: For the period there are 4 bars with the time of the opening 10:0 .Bullish- 2.Bearish- 2.Equal - 0
15:33:53 script_Statistics_candles_V2 EURUSD,H1: For the bars with the opening time 10:0,average distance between the Open-Close prices - 12.75 points. Between the High-Low prices - 34 points.
15:33:53 script_Statistics_candles_V2 EURUSD,H1: For the period there are 4 bars with the time of the opening 11:0 .Bullish- 3.Bearish- 1.Equal - 0
15:33:53 script_Statistics_candles_V2 EURUSD,H1: For the bars with the opening time 11:0,average distance between the Open-Close prices - 11.5 points. Between the High-Low prices - 26.75 points.
15:33:53 script_Statistics_candles_V2 EURUSD,H1: For the period there are 4 bars with the time of the opening 12:0 .Bullish- 3.Bearish- 1.Equal - 0
15:33:53 script_Statistics_candles_V2 EURUSD,H1: For the bars with the opening time 12:0,average distance between the Open-Close prices - 20.75 points. Between the High-Low prices - 24.5 points.
15:33:53 script_Statistics_candles_V2 EURUSD,H1: For the period there are 4 bars with the time of the opening 13:0 .Bullish- 3.Bearish- 1.Equal - 0
15:33:53 script_Statistics_candles_V2 EURUSD,H1: For the bars with the opening time 13:0,average distance between the Open-Close prices - 7 points. Between the High-Low prices - 18.5 points.
15:33:53 script_Statistics_candles_V2 EURUSD,H1: For the period there are 4 bars with the time of the opening 14:0 .Bullish- 2.Bearish- 2.Equal - 0
15:33:53 script_Statistics_candles_V2 EURUSD,H1: For the bars with the opening time 14:0,average distance between the Open-Close prices - 18.25 points. Between the High-Low prices - 31.75 points.
15:33:53 script_Statistics_candles_V2 EURUSD,H1: For the period there are 4 bars with the time of the opening 15:0 .Bullish- 3.Bearish- 1.Equal - 0
15:33:53 script_Statistics_candles_V2 EURUSD,H1: For the bars with the opening time 15:0,average distance between the Open-Close prices - 21.25 points. Between the High-Low prices - 34.25 points.
15:33:53 script_Statistics_candles_V2 EURUSD,H1: For the period there are 4 bars with the time of the opening 16:0 .Bullish- 2.Bearish- 2.Equal - 0
15:33:53 script_Statistics_candles_V2 EURUSD,H1: For the bars with the opening time 16:0,average distance between the Open-Close prices - 7 points. Between the High-Low prices - 23.75 points.
15:33:53 script_Statistics_candles_V2 EURUSD,H1: For the period there are 4 bars with the time of the opening 17:0 .Bullish- 2.Bearish- 2.Equal - 0
15:33:53 script_Statistics_candles_V2 EURUSD,H1: For the bars with the opening time 17:0,average distance between the Open-Close prices - 12.25 points. Between the High-Low prices - 31.75 points.
15:33:53 script_Statistics_candles_V2 EURUSD,H1: For the period there are 4 bars with the time of the opening 18:0 .Bullish- 0.Bearish- 4.Equal - 0
15:33:53 script_Statistics_candles_V2 EURUSD,H1: For the bars with the opening time 18:0,average distance between the Open-Close prices - 6.75 points. Between the High-Low prices - 31.75 points.
15:33:53 script_Statistics_candles_V2 EURUSD,H1: For the period there are 4 bars with the time of the opening 19:0 .Bullish- 2.Bearish- 2.Equal - 0
15:33:53 script_Statistics_candles_V2 EURUSD,H1: For the bars with the opening time 19:0,average distance between the Open-Close prices - 19.25 points. Between the High-Low prices - 28.25 points.
15:33:53 script_Statistics_candles_V2 EURUSD,H1: For the period there are 4 bars with the time of the opening 20:0 .Bullish- 2.Bearish- 2.Equal - 0
15:33:53 script_Statistics_candles_V2 EURUSD,H1: For the bars with the opening time 20:0,average distance between the Open-Close prices - 11.75 points. Between the High-Low prices - 21.75 points.
15:33:53 script_Statistics_candles_V2 EURUSD,H1: For the period there are 4 bars with the time of the opening 21:0 .Bullish- 3.Bearish- 1.Equal - 0
15:33:53 script_Statistics_candles_V2 EURUSD,H1: For the bars with the opening time 21:0,average distance between the Open-Close prices - 14 points. Between the High-Low prices - 20.75 points.
15:33:53 script_Statistics_candles_V2 EURUSD,H1: For the period there are 4 bars with the time of the opening 22:0 .Bullish- 3.Bearish- 1.Equal - 0
15:33:53 script_Statistics_candles_V2 EURUSD,H1: For the bars with the opening time 22:0,average distance between the Open-Close prices - 13.25 points. Between the High-Low prices - 26 points.
15:33:53 script_Statistics_candles_V2 EURUSD,H1: For the period there are 3 bars with the time of the opening 23:0 .Bullish- 1.Bearish- 2.Equal - 0
15:33:53 script_Statistics_candles_V2 EURUSD,H1: For the bars with the opening time 23:0,average distance between the Open-Close prices - 7.6667 points. Between the High-Low prices - 15.6667 points.
15:33:53 script_Statistics_candles_V2 EURUSD,H1: -------------- Script completed the work --------------------
15:33:53 script_Statistics_candles_V2 EURUSD,H1: uninit reason 0
15:33:53 script_Statistics_candles_V2 EURUSD,H1: removed
Input the working results into the table. Let's agree to input the number of bullish bars into column "B", the number of bearish bars into column "M", and not to enter the number of "no" bars into the table.
| Opening Hour | 00 | 01 | 02 | 03 | 04 | 05 | 06 | 07 | 08 | 09 | 10 | 11 | 12 | 13 | 14 | 15 | 16 | 17 | 18 | 19 | 20 | 21 | 22 | 23 | ||||||||||||||||||||||||
| Bar Type | M |
B |
M |
B |
M |
B |
M |
B |
M |
B |
M |
B |
M |
B |
M |
B |
M |
B |
M |
B |
M |
B |
M |
B |
M |
B |
M |
B |
M |
B |
M |
B |
M |
B |
M |
B |
M |
B |
M |
B |
M |
B |
M |
B |
M |
B |
M |
B |
11.20-11.26 |
3 | 1 | 2 | 1 | 2 | 2 | 2 | 2 | 4 | 0 | 2 | 2 | 2 | 1 | 3 | 1 | 2 | 2 | 3 | 0 | 2 | 2 | 1 | 3 | 3 | 1 | 2 | 2 | 2 | 1 | 2 | 2 | 3 | 0 | 1 | 3 | 2 | 2 | 2 | 2 | 2 | 2 | 3 | 1 | 3 | 1 | 2 | 1 |
11.21-11.27 |
4 | 1 | 2 | 1 | 1 | 3 | 2 | 2 | 3 | 1 | 2 | 2 | 3 | 0 | 3 | 1 | 2 | 2 | 2 | 1 | 3 | 1 | 1 | 3 | 4 | 0 | 2 | 2 | 2 | 1 | 3 | 1 | 4 | 0 | 2 | 2 | 2 | 2 | 2 | 2 | 2 | 2 | 4 | 0 | 3 | 1 | 2 | 1 |
11.22-11.28 |
5 | 1 | 2 | 1 | 2 | 3 | 2 | 3 | 4 | 1 | 3 | 2 | 3 | 1 | 3 | 2 | 3 | 2 | 3 | 1 | 3 | 2 | 1 | 4 | 4 | 1 | 3 | 2 | 2 | 2 | 4 | 1 | 4 | 1 | 2 | 3 | 3 | 2 | 2 | 3 | 2 | 5 | 0 | 3 | 2 | 3 | 1 | |
11.23-11.29 |
4 | 1 | 2 | 1 | 2 | 3 | 2 | 3 | 4 | 1 | 3 | 2 | 3 | 1 | 3 | 2 | 3 | 2 | 3 | 1 | 3 | 2 | 1 | 4 | 4 | 1 | 3 | 2 | 2 | 2 | 4 | 1 | 4 | 1 | 2 | 3 | 3 | 2 | 2 | 3 | 3 | 2 | 5 | 0 | 3 | 2 | 3 | 1 |
11.24-11.30 |
3 | 1 | 2 | 1 | 2 | 2 | 2 | 2 | 3 | 1 | 2 | 2 | 2 | 1 | 2 | 2 | 2 | 2 | 3 | 1 | 2 | 2 | 1 | 3 | 3 | 1 | 2 | 2 | 2 | 2 | 4 | 0 | 3 | 1 | 2 | 2 | 3 | 1 | 2 | 2 | 2 | 2 | 4 | 0 | 2 | 2 | 2 | 1 |
11.25-12.01 |
3 | 1 | 2 | 0 | 1 | 3 | 1 | 3 | 3 | 1 | 3 | 1 | 3 | 1 | 2 | 2 | 2 | 2 | 3 | 1 | 2 | 2 | 2 | 2 | 2 | 2 | 3 | 1 | 1 | 3 | 3 | 1 | 2 | 2 | 2 | 2 | 3 | 1 | 3 | 1 | 1 | 3 | 4 | 0 | 2 | 2 | 2 | 2 |
11.26-12.02 |
3 | 0 | 2 | 1 | 2 | 2 | 0 | 4 | 2 | 2 | 3 | 1 | 2 | 2 | 2 | 2 | 3 | 1 | 3 | 1 | 2 | 2 | 2 | 2 | 2 | 2 | 4 | 0 | 0 | 4 | 2 | 2 | 2 | 2 | 2 | 2 | 4 | 0 | 3 | 1 | 2 | 2 | 3 | 0 | 3 | 1 | 3 | 1 |
11.27-12.03 |
3 | 0 | 2 | 2 | 3 | 1 | 0 | 4 | 2 | 2 | 2 | 2 | 1 | 3 | 2 | 2 | 4 | 0 | 3 | 1 | 2 | 2 | 2 | 2 | 1 | 3 | 3 | 1 | 1 | 3 | 1 | 3 | 2 | 2 | 1 | 3 | 3 | 1 | 3 | 1 | 2 | 2 | 2 | 0 | 0 | 4 | 2 | 2 |
11.28-12.04 |
3 | 1 | 1 | 3 | 2 | 2 | 0 | 4 | 1 | 3 | 1 | 3 | 2 | 2 | 3 | 1 | 3 | 1 | 3 | 1 | 2 | 2 | 2 | 2 | 1 | 1 | 3 | 1 | 2 | 2 | 0 | 4 | 2 | 2 | 1 | 3 | 3 | 1 | 3 | 1 | 1 | 2 | 1 | 1 | 1 | 3 | 2 | 2 |
11.29-12.05 |
3 | 2 | 1 | 3 | 3 | 2 | 1 | 4 | 1 | 4 | 1 | 4 | 3 | 2 | 4 | 1 | 3 | 2 | 4 | 1 | 3 | 2 | 2 | 3 | 1 | 4 | 3 | 2 | 2 | 3 | 1 | 4 | 2 | 3 | 1 | 4 | 3 | 2 | 4 | 1 | 1 | 3 | 1 | 2 | 1 | 4 | 3 | 2 |
11.30-12.06 |
2 | 2 | 1 | 3 | 3 | 2 | 1 | 4 | 1 | 4 | 1 | 4 | 3 | 2 | 4 | 1 | 3 | 2 | 4 | 1 | 3 | 2 | 2 | 3 | 4 | 1 | 3 | 2 | 2 | 3 | 1 | 4 | 2 | 3 | 1 | 4 | 3 | 2 | 4 | 1 | 1 | 3 | 1 | 2 | 1 | 4 | 3 | 2 |
12.01-12.07 |
2 | 1 | 4 | 0 | 1 | 3 | 3 | 1 | 4 | 0 | 4 | 0 | 2 | 2 | 3 | 1 | 2 | 2 | 3 | 1 | 2 | 2 | 1 | 3 | 1 | 3 | 2 | 2 | 2 | 2 | 1 | 3 | 2 | 2 | 1 | 3 | 2 | 2 | 3 | 1 | 1 | 2 | 0 | 2 | 1 | 3 | 3 | 1 |
12.02-12.08 |
2 | 2 | 1 | 4 | 3 | 1 | 1 | 3 | 1 | 3 | 1 | 3 | 3 | 1 | 3 | 1 | 1 | 3 | 3 | 1 | 3 | 1 | 0 | 4 | 0 | 4 | 2 | 2 | 2 | 2 | 1 | 3 | 2 | 2 | 1 | 3 | 2 | 2 | 3 | 1 | 1 | 2 | 1 | 2 | 1 | 3 | 3 | 1 |
Table 1. The working results of the Expert Advisor
Well, Let us now look at the results. First of all, it turned out that some bars had the same direction at the same period of time, which is particularly interesting. Notice that the cells are painted in different colors. I marked the cells only contained bearish bars over the last 6 days in yellow, and the ones which only contained bullish bars in pink.
On the 26th of November we see that over the past 6 days, during the opening hours of 4,9, and 16, all of the bars were bearish. We can assumed that the bears are strong today, and perhaps even tomorrow the market will be bearish.
November 27. Our forecast proved to be correct. The script results show that over the last 6 days, at 6, 12, 16, and 21 hours, the candles were only bearish, and thus we can assume that the market will continue to be bearish.
November 28. Our forecast proved to be correct. Over the last 6 days, the number of bearish candles decreased, and only during the hour of 21 they were completely bearish. We can assumed that the bear trend died down, and will soon begin to change.
29,30 of November, 1 and 2 of January, we have the same situation. We're in a sideways trend. But interestingly enough, from the 2nd of January, only bullish candles begin to appear, we assume that the trend will shift, and as the day continues, we see that we were correct in our assumptions.
We will witness an interesting situation on the 5th and 6th of December. There isn't a single time interval, in which the candles lean in the same direction. Something must happen. But when we look at the terminal, we realize with relief that these strange days fell on a weekend.
On December 7th we again have multi-directional candles, and are again waiting for changes in the trend.
On December 8th we have purely bullish candles at 11 and 12 hours. In Figure 1, the trend seems to be bearish? But if we look at the terminal, we will be surprised to see that around 12 o'clock, the trend will become sidish, and from December 9th, it will turn into a bullish trend.
Well. As we can see, this method can not give us an 100% guarantee, and there is yet no tool that can. But it can be very valuable, and in conjunction with other methods of technical analysis, it can greatly help in predicting the behavior of the market for the next day or two.
Conclusion
In writing this article, I set three goals before myself:
- First, to show the necessity of learning the language of MQL4, through which your ability to analyze trade increased enormously, and to offer those who are interested a tool for independent analysis of the recurrence of candles for different time intervals and currency pairs.
- Secondly, to check whether there are recurring candles at different intervals in history, and it was a discovery for me that over the course of a few days, some candles, with the same opening time, held the same direction.
- And thirdly, to see whether a change in the direction of candles can serve as a tool for predicting the changes of trend directions.
It's obvious that I couldn't perform a very deep analysis of the behavior of candles on different time graphs, in a single article, nor was I planning to do this in the first place. Everyone can explore and analyze those pairs and timeframes, which are particularly interesting to him. The script is in the attached file.
Thank you.
Translated from Russian by MetaQuotes Ltd.
Original article: https://www.mql5.com/ru/articles/1576
 Using WinInet.dll for Data Exchange between Terminals via the Internet
 Creating a Multi-Currency Indicator, Using a Number of Intermediate Indicator Buffers
 An Example of a Trading System Based on a Heiken-Ashi Indicator
 Step-By-Step Guide to writing an Expert Advisor in MQL5 for Beginners
- Free trading apps
- Over 8,000 signals for copying
- Economic news for exploring financial markets
You agree to website policy and terms of use
Hello,
How to translate :
"Mas vira maina" in english ?
Regards,
pierre8r
"Mas vira mainas" it's not russian. But the script gives me faulse results ! What about you ?
Vous êtes français ?
Hello,
How to translate :
"" in english ?
Regards,
pierre8r
Go to the www.themoneyclock.com and watch the whole video. August 10, 2012